The Litecoin price could rise sharply now, because it is on the threshold of a bullish breakout. Will the LTC price be able to break the trend line?
Will the Litecoin price be able to rise to the 50-month EMA?
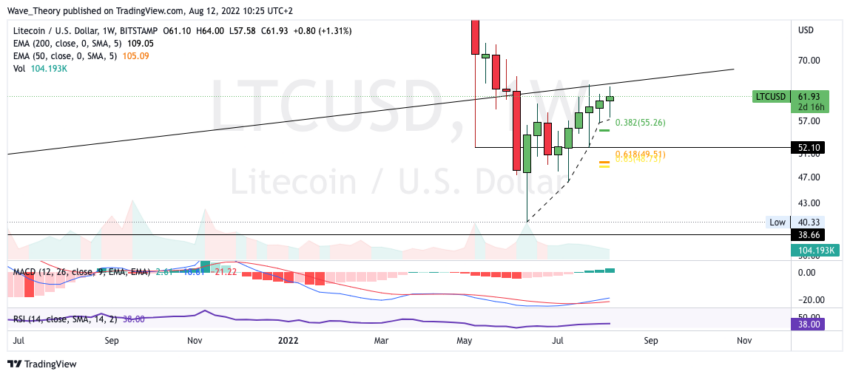
The Litecoin price is still at the trend line at which it was rejected last month. If LTC breaks the trend line bullish, it could rise to the next Fib levels at around $ 80 or even $ 105, with the 50-month EMA at around $ 100 acting as a significant resistance.
In addition, the histogram has been ticking bullish higher so far this month and if it closes bullish, this would be an indication of a bullish trend reversal.
Will the Litecoin price break the trend line bullish now?

In addition, the histogram of the MACD ticks bullish higher in the weekly chart and the MACD lines are also crossed bullish. Meanwhile, the RSI is neutral.
If the LTC price is rejected again at the trend line, significant Fib supports are waiting at around $ 55 and $ 50.
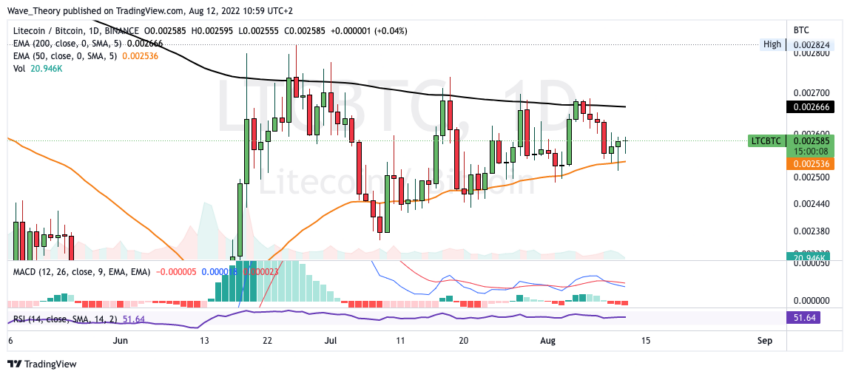
The 50-day EMA at around $59 serves as support

In addition, the LTC price is still above the 50-day EMA, which serves as support at around $ 59. In the daily chart, the MACD is indecisive, because the histogram ticks both bullish higher and bearish lower, while the MACD lines are on top of each other.
In addition, the LTC price forms a series of higher lows, because LTC recently formed the fourth higher low in a row.
Against BTC, LTC is still moving between the EMAs

Since the last LTC price forecast, which was published almost a week ago, not much has changed. The LTC price is still moving between 200-day EMA resistance and 50-day EMA support against BTC. So, at around 0.0027 BTC, LTC encounters resistance, whereas it finds support at around 0.0025 BTC.
The MACD is bearish in the daily chart, because the histogram ticks bearishly lower and the MACD lines are crossed bearishly.
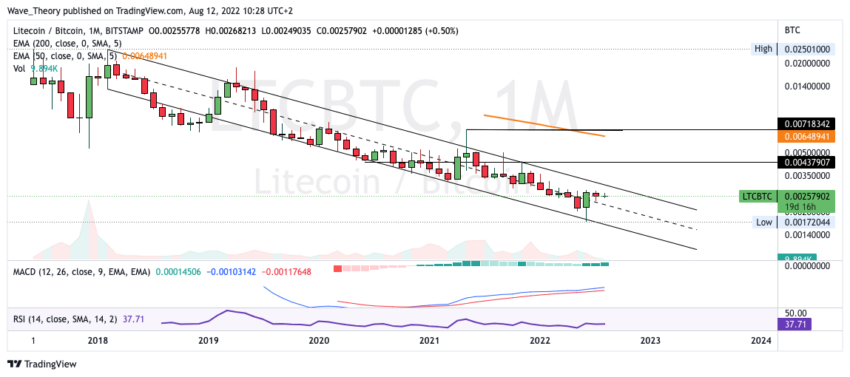
LTC’s long-term Trend against BTC remains Strongly Bearish

Against BTC, Litecoin has been in a parallel downward channel for years. The MACD is still bullish on the monthly chart, because the histogram ticks bullish higher and the MACD lines are crossed bullish.
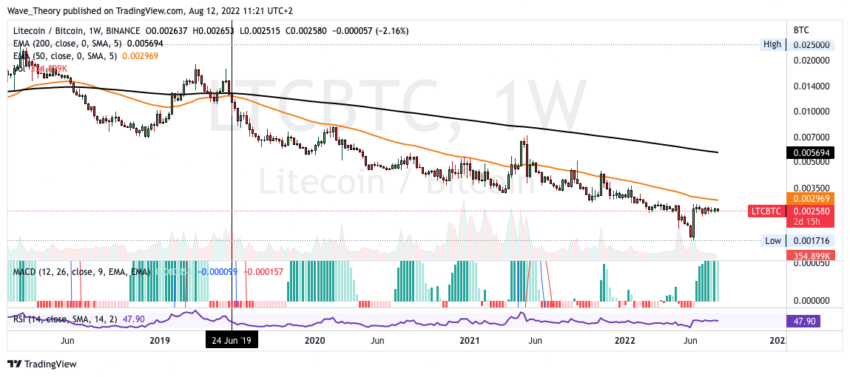
The 50-week EMA acts as a key resistance

The 50-week EMA acts as a key resistance, which has only been broken once for almost four years, after which the Litecoin price immediately returned below the 50-week EMA without touching the 200-week EMA.
Disclaimer
All information contained on our website is researched to the best of our knowledge and belief. The journalistic articles are for general information purposes only. Any action taken by the reader on the basis of the information found on our website is done exclusively at his own risk.


